MCT DAILY

No fake news. No noise. Just the facts you need.

The morning Daily Brief anchors the day. New developments and short explainers follow when the story changes.

FIVE THINGS TO KNOW…

Short explainers published throughout the day.

MCT READER PULSE · MCT-PULSE-2026-002

MCT READER SURVEY

Are you in favor of Pax Silica?Pabor ka ba sa Pax Silica?

This short reader pulse asks MCT readers for their present view of Pax Silica.

This is an informal MCT reader pulse, not a scientific or nationally representative poll. It reflects only the views of verified readers who choose to participate.

View reader pulse archive →
Checking your reader session…

August 6, 2026 · 12:50 PM8-minute read

FIVE THINGS TO KNOW ABOUT THE 6.2 PERCENT INFLATION RATE AND WHY PRICES STILL FEEL HIGH

What the 6.2 percent national rate measures, why lower-income households recorded 8.2 percent inflation, and what the figures mean for an ordinary family budget.

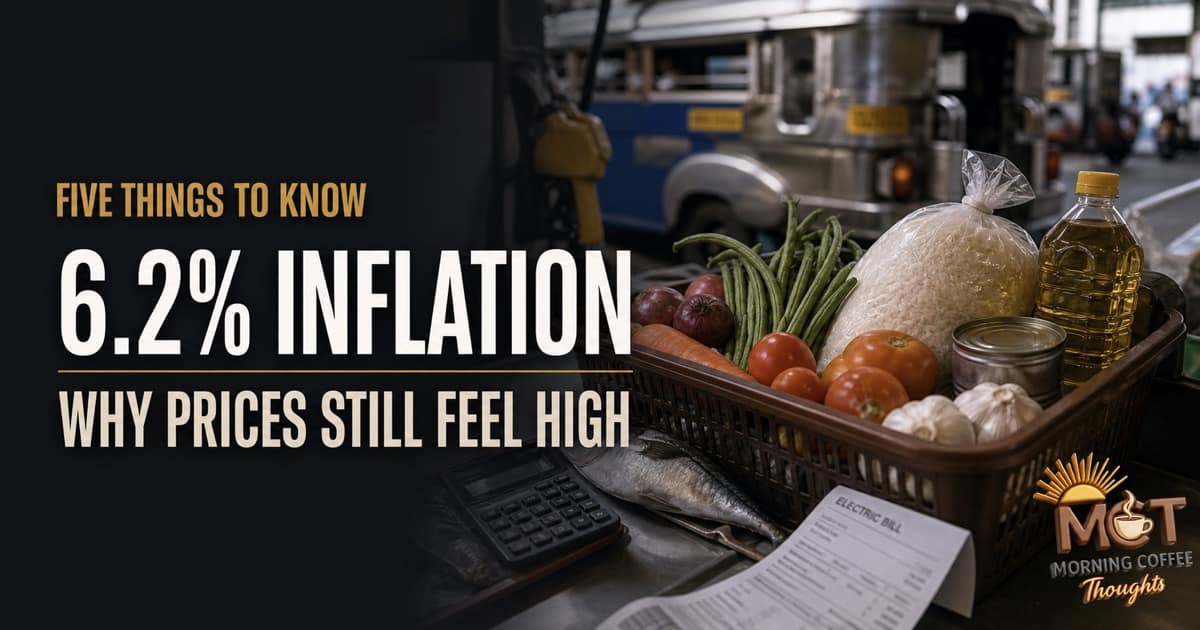
A Filipino market basket, jeepney and electricity bill illustrating why prices still feel high at 6.2 percent inflation.

The Philippine Statistics Authority reported that inflation slowed to 6.2 percent in July 2026 from 6.4 percent in June.

A lower inflation rate can sound as though goods have become cheaper. That is not what the figure means. The 6.2 percent rate compares the average prices recorded in July 2026 with those from July 2025. It also combines prices from different products and different parts of the country into one national number.

The full report gives a more detailed account. Food, utilities and transport remain among the largest sources of price pressure. Households in the bottom 30 percent of the income distribution experienced 8.2 percent inflation. Several regions also recorded rates above the national average.

These are five things to know when reading the July inflation report.

1

THE 6.2 PERCENT RATE MEASURES THE CHANGE OVER ONE YEAR

The July figure tells us that the average consumer basket was 6.2 percent more expensive than it was in July 2025.

If a basket cost ₱1,000 one year ago and followed the national inflation rate exactly, it would cost about ₱1,062 in July 2026.

The rate falling from 6.4 percent in June to 6.2 percent in July means the yearly increase became slightly slower. The prices already added during the previous months remain part of the amount consumers pay.

The PSA also publishes a seasonally adjusted comparison. This removes price movements that regularly happen at particular times of the year. After that adjustment, the national price index showed no increase between June and July.

The two measurements answer different questions. The 6.2 percent figure compares July with the same month last year. The flat monthly figure compares July with June after seasonal effects are removed. Together, they show that prices remained well above last year's level but did not increase further during the latest month.

For a household, the monthly pause prevents an immediate additional increase. It does not restore the buying power lost during earlier price increases.

WHAT TO WATCH

The PSA will release the August inflation report on September 4. The year-on-year rate will show whether inflation continued to slow. The seasonally adjusted monthly figure will show whether the pause in price increases lasted beyond July.

2

FOOD, HOUSING COSTS AND TRANSPORT PRODUCED MOST OF THE JULY INFLATION

Food and non-alcoholic beverages contributed 2.0 percentage points to the national inflation rate. Housing, water, electricity, gas and other fuels contributed 1.7 points. Transport contributed 1.1 points.

The three groups accounted for 4.8 percentage points of the 6.2 percent headline rate. That is more than three quarters of the total.

National food inflation was 5.3 percent. Housing, water, electricity, gas and other fuels rose by 8.2 percent. Transport prices were 11.9 percent higher than they were one year earlier.

Transport was also the main reason the national inflation rate slowed in July. Its yearly increase fell from 12.8 percent in June to 11.9 percent in July. The pressure eased, but transport remained one of the fastest-rising major expenses.

These categories appear regularly in household budgets. Families buy food throughout the month, use utilities at home and pay for travel to work or school. Higher transport costs can also enter the prices of goods moved from farms, ports and warehouses to local markets.

A household with a fixed budget must respond by buying fewer items, choosing cheaper substitutes or reducing spending elsewhere. This is why a small change in the national rate may not produce an obvious change in weekly expenses.

WHAT TO WATCH

Watch the September 4 report for changes in food, housing and transport. Weekly fuel adjustments, electricity and water rate announcements, and the prices of rice, fish and vegetables will help show whether the national slowdown is reaching frequently purchased essentials.

3

THE PSA RECORDED 8.2 PERCENT INFLATION FOR THE BOTTOM 30 PERCENT

The PSA calculates a separate inflation rate for households in the bottom 30 percent of the income distribution. This index uses a separate market basket and separate spending weights based on the goods commonly purchased by these households.

Their inflation rate increased from 8.0 percent in June to 8.2 percent in July. The national rate for all income households moved in the opposite direction, falling from 6.4 percent to 6.2 percent.

Food inflation for the bottom 30 percent reached 8.5 percent. Housing, water, electricity, gas and other fuels rose by 10.1 percent. Transport increased by 14.2 percent. The rice index was 19.3 percent higher than it was in July 2025.

Food and non-alcoholic beverages accounted for 54 percent of the inflation measured for this group. In the national index for all income households, the same category accounted for 32.1 percent.

The different market baskets explain why the two inflation rates can move differently. A household that spends a larger share of its budget on food and other essentials feels more of the increase when those items rise quickly.

For illustration, a ₱10,000 basket following the national rate would cost about ₱10,620 after one year. A ₱10,000 basket following the bottom 30 percent rate would cost about ₱10,820. Actual household purchases will differ from either PSA basket, but the example shows the size of the gap between the two measurements.

For a lower-income household, an additional expense of this size can reduce the money available for medicine, school costs, debt payments or savings.

WHAT TO WATCH

The next bottom 30 percent report will show whether inflation for this group begins to slow. The rice, fish, vegetable, transport and utility indices deserve particular attention because they account for a large part of the household budget and the measured increase.


4

THE NATIONAL RATE DOES NOT DESCRIBE EVERY REGION

Inflation in the National Capital Region was 4.4 percent in July. Outside Metro Manila, it was 6.7 percent.

Central Visayas recorded the highest regional rate at 8.7 percent. The Ilocos Region had the lowest at 5.1 percent.

The regional difference was wider for households in the bottom 30 percent. Their inflation rate was 4.5 percent in Metro Manila and 8.3 percent outside it. Central Visayas and the Davao Region both recorded 11.6 percent for this income group.

The national rate combines many local price movements into a single average. Households buy from nearby markets and pay the fares and utility rates available where they live. Their personal cost of living can therefore rise faster or slower than the national figure.

The national July release identifies the regional differences, but it does not establish one common cause for all of them. Understanding a particular region requires looking at its own food, transport, housing and utility indices.

For readers, the regional or provincial figure may provide a closer comparison with their household expenses than the national rate alone.

WHAT TO WATCH

Check the PSA's August report for your region or province. Read the local category increases alongside the regional headline. This will show whether the gap between Metro Manila and the rest of the country is narrowing or widening.

5

LOWERING INFLATION INVOLVES BOTH INTEREST RATES AND SUPPLY

The government's inflation target is 3 percent, with an acceptable range of 2 to 4 percent. The July headline rate of 6.2 percent remained above that range.

Core inflation was 4.2 percent. Core inflation removes selected food and energy products that can change sharply from month to month. Economists and the Bangko Sentral ng Pilipinas use it to examine price pressure beyond those volatile items.

The Monetary Board raised the BSP policy rate to 4.75 percent in June. Changes in the policy rate can pass through to bank lending and deposit rates. Higher borrowing costs can reduce spending and demand, which can help slow inflation over time.

The same policy can make some loans more expensive for households and businesses. The effect on an existing loan depends on its contract and whether its interest rate can be repriced.

Interest-rate policy also has limited reach over supply problems. It cannot directly increase rice production, lower international oil prices or remove transport bottlenecks. Food supply, fuel costs, electricity rates and logistics require action from other government agencies and industries.

Income is the final part of the household calculation. If a worker's income rises by 4 percent while household expenses rise by 6.2 percent, buying power still falls. A family begins to recover when its income grows faster than its own essential expenses.

WHAT TO WATCH

The Monetary Board will hold its next policy meeting on August 27. Its decision will indicate whether interest rates are likely to remain elevated. Also watch for measurable government action affecting food supply, fuel, transport and electricity, followed by the September 4 inflation report showing whether those pressures changed.

BOTTOM LINE

The 6.2 percent inflation rate shows that the yearly increase in average prices became slightly slower in July. The separate monthly measurement also shows that the national price index was flat between June and July after seasonal effects were removed. Prices remain higher than they were one year ago. Food, housing-related expenses and transport produced most of the July increase. The burden also differed by income and location: the bottom 30 percent recorded 8.2 percent inflation, while several regions experienced rates above the national average. The national headline is useful for tracking the country as a whole. A household will understand its own situation more clearly by also checking the prices it pays most often, its regional inflation rate and whether its income is keeping pace.

RECENT COMMENTARY

THE LATEST FROM MCT

View all commentary →

SUPPORT MCT

HELP KEEP INDEPENDENT POLITICAL WRITING GOING.

Morning Coffee Thoughts is reader-supported. Contributions help pay for research tools, hosting, and the work required to verify and explain each development.

Choose the monthly support amount you are comfortable with.Continue through PayPal
Send support through GCash0969 314 4839